Here's a graph she found in yesterday's Independent on Sunday:
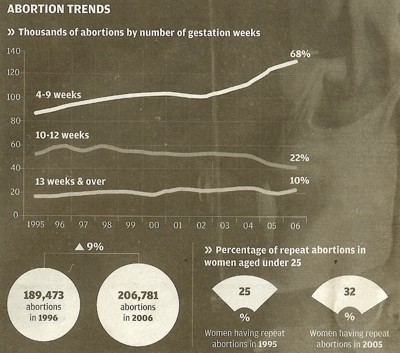
So, there was a 9% increase in abortions (the text makes clear that this is in the UK) between 1996 and 2006. This isn't a post about abortion rates, though, just the use of statistics.
OK, well (206781-189473)/189473=0.0913481 (to 7 decimal places), so rounding it to 9% is reasonable. Of course, you probably should take into account that the population of the UK was around 58,164,000 mid-1996 and 60,600,000 mid-2006, an increase of (60600-58164)/58164=0.0418815 (ie. 4%), most of whom would be nearer child-bearing age than the rest of the population, so a rise of 9% isn't quite as striking as it might at first appear.
Let's take a look at those circles showing the relative sizes, though:

Hmm, that one on the right looks rather more than 9% larger than the one on the left. If only there were some way of measuring it to check. Say, by counting the number of pixels in their diameters?
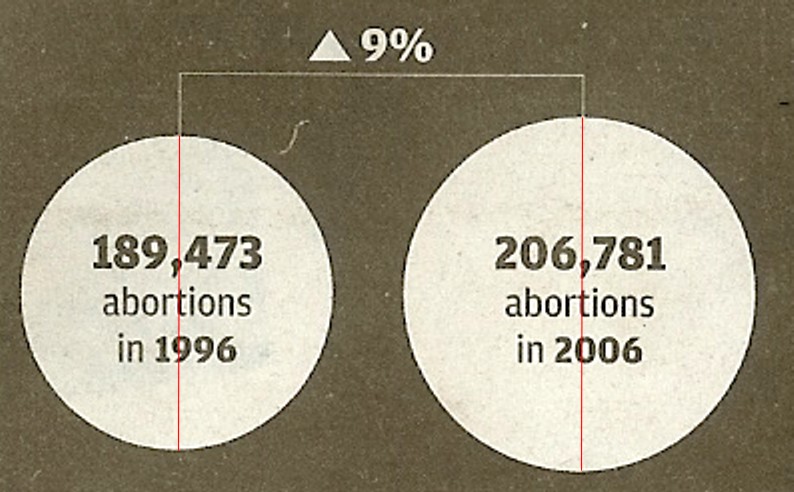
The line on the left is 316 pixels in length; the line on the right is 354 pixels in length. (354-316)/316=0.1202531 — that's 12%, not 9%!
It's actually worse than this. Circles are area things, not height things: when you see two circles next to each other, you compare their areas, not their diameters. (π(354/2)2-π(316/2)2)/(π(316/2)2)=(1772-1582)/1582=0.2549671 — that's a 25% difference in size. The right-hand circle has a quarter as much white space as the left-hand circle, to represent a figure of 9%.
Even when it tries to be scientific, The Independent still manages to be unscientific. This is why mathematicians and periodicals rarely get along...